
Hi Rick,
We're having a problem in web connect with out of memory errors. I know comm servers in VFP have known issues with memory leaks from posts I've seen from Tamar and others.
To account for this, we run this at the end of every request so we can try to clear out memory every 30 minutes or so and I believe this is working as our actual COMM exe's are staying within acceptable memory ranges (i.e. 20-70ish Mb)
IF VARTYPE(g_lastMemRel) != 'T'
	* First time through, don't need to release memory yet. SRR 10/18/2024
	PUBLIC g_lastMemRel
	g_lastMemRel = DATETIME()
ENDIF
IF DATETIME() - g_lastMemRel > 60*30 && 30 minutes
	cp_relMemory()
	g_lastMemRel = DATETIME()
ENDIF


******************************************************************************************************
PROCEDURE cp_relMemory
* This will release memory back to windows.

* Christof's execellent article on VFP in general (includes a section on memory): http://www.foxpert.com/docs/howfoxproworks.en.htm
* Rick Strahl's talking about memory references stuck in memory: https://www.west-wind.com/wconnect/weblog/ShowEntry.blog?id=692
* Tamar Granor having problems with VFP Com objects & memory leaks: https://www.tek-tips.com/threads/trying-to-track-down-memory-leak-s.1547262/


* First, make sure I've cleared up any garbage
SYS(1104) && purge cached memory

* Now release some memory
* Got this from https://www.foxite.com/faq/default.aspx?id=55
Declare Integer SetProcessWorkingSetSize In kernel32 As SetProcessWorkingSetSize  ;
	Integer hProcess , ;
	Integer dwMinimumWorkingSetSize , ;
	Integer dwMaximumWorkingSetSize

Declare Integer GetCurrentProcess In kernel32 As GetCurrentProcess

nProc = GetCurrentProcess()
bb = SetProcessWorkingSetSize(nProc,-1,-1)


ENDPROC && cp_relMemory
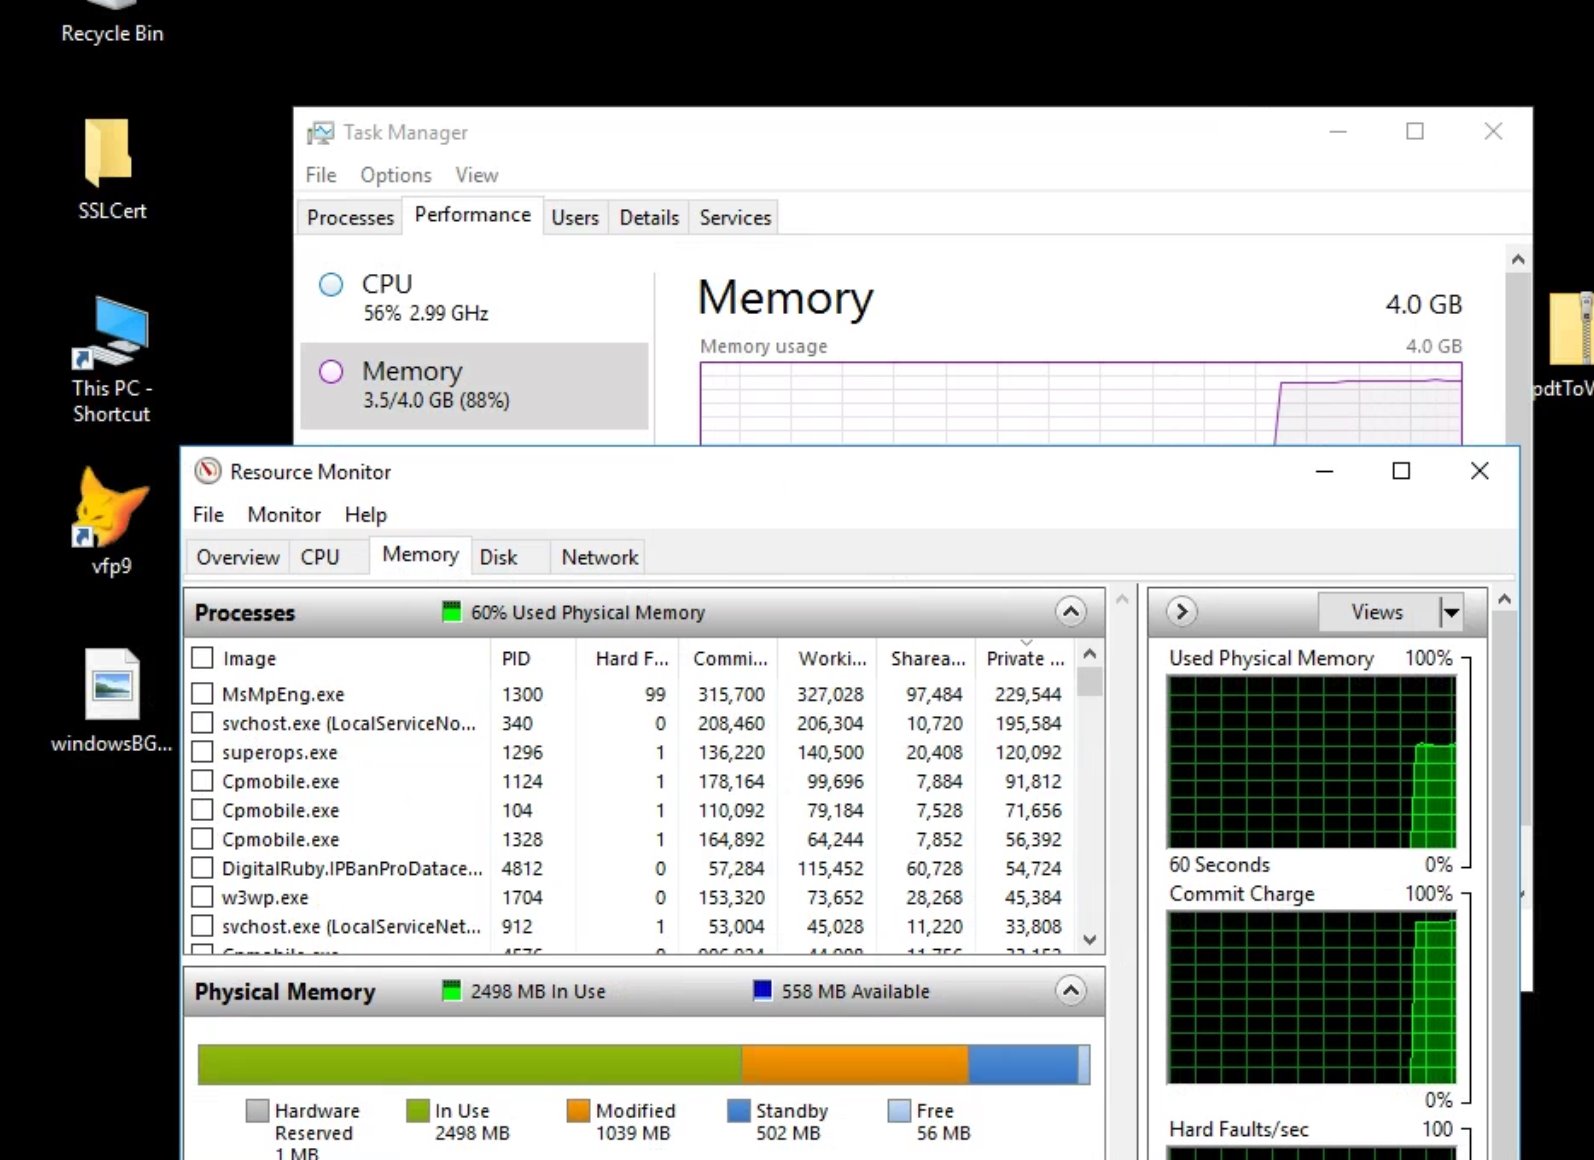
This has worked well for us but we are now getting a lot of servers running out of memory even though our COMM servers are not taking much. When I look at it in Task manager versus resource manager, Task manager shows the server at a much higher % than resource monitor as far as memory usage. However, when I recycle the app pool in IIS, I get all of the memory back and task manager / resource manager now match (off by 1% but I assume that's differences is rounding)
cpmobile.exe is our COMM server running through webconnect.
What I'm wondering is, especially since I can't see any processes that add up to the memory in use, when a COMM server crashes / dies, does the memory not get released back to windows with however you are managing those? If so, is there a way to fix this or is my only option to recycle the app pool more frequently?


Hi Scott,
That looks like a very interesting strategy considering what I recently ran into related to corrupted memory space. I'll be watching this thread.... 😃
We found the runaway method that was causing problem (it was a bad SQL query and was timing out and going beyond the max timeout in IIS for each request) and so we're not crashing the comm servers anymore but I'd still like to understand why the memory in windows is getting "out of sync" with comm servers and why crashed / terminated comm servers are holding onto memory and the only way to get it back is to release all comm servers / recycle the app pool?

FWIW, SetWorkingSetSize() doesn't change actual memory usage - it only changes what the application reports to Windows. It's a nice hack for desktop application to make them look to be using less memory than they actually are 😄 Ask me how I know, ha ha...
Memory usage can be tricky because FoxPro loads memory and doesn't give it back immediately. So if you have a large POST buffer incoming - say from a file upload or some other large text payload that memory doesn't release immediately - even if you explicitly reassign it or clear it in code.
In Web Connection 8.0 I did a bit of work to be able to handle > 16mb POST data and there are some optimizations that clear out memory - not to reduce the memory usage so much but to be able to squeeze things into the limited support for >16mb string limit that FoxPro supports. I remember looking at the memory usage when I worked with that and even though I released strings at the end of the request, the mem usage wouldn't clear immediately. Internally the values would reduce but externally in what Windows reports not.
The main issues I see with with memory leakage in FoxPro are not large strings etc. but rather hanging object references that aren't released. Arrays and collections that contain objects are a common place where this goes wrong. Those will add up and just never release if you lose the reference. In Web Connection this tends to be less of a problem (unless you use the old Web Control framework which requires explicit release of components) since there aren't lots of object in the framework and most of the objects are not nested but of course it depends on application code and what it's doing.
+++ Rick ---

Interesting... Good to know it's not actually really releasing memory. I've read your previous articles about object references and memory. We don't use a lot of objects, mostly cursors as we're just facilitating data back from the SQL DB to the portal but maybe there's something I can track down there.
Is there any actual way to release memory back to windows? i.e. if we do some large image processing, is there a way to release memory back to windows or is it not worth the hassle?
Also, apparently we're still having memory issues. I'm not sure what suddenly started causing this. Do you have any tips on how to track down which methods are causing it to slowly creep up in memory usage? i.e. we're going from 1.9 Gb of ram usage on the server to 3.8 Gb of memory usage over the course of anywhere from 3-8 hours. It's not drastic and very incremental but consistent..
Logging is the only way. Log each request, and use the various memory SYS() functions to log memory on the way in and on the way out.
If you do this for all requests you're likely to see patterns of which requests are causing a lot of memory usage increases. If it's all requests then it's perhaps something common.
I would also recommend relatively frequent Application pool cycling (set up in the IIS Application Pool settings).
I do mine once a day even though I have no issues, but you might want to do it more frequently. Application Pool shutdowns are pretty orderly with IIS letting requests finish that are in flight while a new app pool is started. It works well unless you have a lot of long running requests in which case the pool may be killed due to timeout.
Why? FoxPro has a lot of small little issues that can add up and recycling ensures you start fresh on a regular basis. There's little to no cost to this so this is a quick fix for slow deterioration problems like you describe.
Still you likely will want to find what's leaking. Keep in mind if you have large incoming data blocks (uploads perhaps) FoxPro will keep allocating. If the system has lots of memory and there's little load FoxPro will just keep grabbing memory. There's nothing inherently wrong with that. If FoxPro is overallocated (ie. not using most of its allocated memory) it'll give it back as the system comes under more load.
This is the way old school single threaded applications used to run: They assumed they were the only thing running. There are commands to limit FoxPro memory. You can set the memusage key in yourapp.ini which sets SYS(3050,2) that tries to restric FoxPro's memory usage.
Hmmm... just checking and I'm noticing that that key is not actually used internally.
You can do this in your yourappMain.prg in the OnLoad():
IF !EMPTY(this.oConfig.nMemUsage)
   SYS(3050,2,THIS.oConfig.nMemUsage)
ENDIF
Or - I've just added this back into the server here at the bottom of wwServer::Init()
THIS.OnInitCompleted()

IF !EMPTY(this.oConfig.nMemUsage)
	SYS(3050,2,THIS.oConfig.nMemUsage)
ENDIF

ENDFUNC
* wwServer :: Init
This should help try contain VFP's memory usage to whatever limit you set. I would set this around 30mb maybe 50mb which is a lot for FoxPro but not a lot on a system level.
+++ Rick ---
Appreciate the reply. I had actually just finished adding logging on memory levels before you replied so hopefully that reveals something soon.
We used to recycle the app pool every 2ish hours but when we updated to WC 8 we switched it to once a day and have been fine until about the last week or so...
As far as recycling goes, we have the private memory usage set under recycling conditions but it never seems to kick in. We have it set to about 1.5 Gb (1500000 / 1024 / 1024 ~ 1.43 Gb) (I believe it's the sum of all comm servers for the site correct? We run 15-20 Comm servers per server and I figure with approx. 50-100 Mb / comm server that setting seems about right?). It should be well before our server runs out of memory but it never seems to recycle based on that. Should be using Virtual memory usage instead?
The memory usage is for the application pool - your Fox app runs in a separate process so it Application Pool memory doesn't apply to that. Or are you saying it's the application pool that's using the large amount of memory?
+++ Rick ---
No. I momentarily forgot that the VFP comm servers run outside of the app pool memory. I was thinking that since recycling the app pool reset the memory problems it was all connected (even though I know they run outside of the normal IIS process [I've been staring at this too long, forgetting stuff I already know 😉 ])
One more question on recycling. Is IIS recycling always 'graceful' like you mentioned? As in, if I programmatically monitor the memory usage every 30ish minutes (it's a slow memory creep we have) and once it's over say 80% I programmatically recycle the app pool, do you see a problem with that? (this way I don't have to worry about an IIS recycling schedule)
I already have code to give me the total memory usage of the box, but basically, is there a difference between IIS recycling the app pool and me calling:
LOCAL m.cmd
m.cmd = 'C:\Windows\system32\inetsrv\appcmd recycle apppool /apppool.name:"' + oAppPool.name + '"'

RUN /N &cmd
Basically, I'm trying to not recycle more than I need to as we do have a few longer running requests but they're not super frequent and I'd rather just do it as needed rather than on a schedule, assuming my command to recycle the app pool works the same way as IIs doing it and is 'graceful' and doesn't terminate currently running requests.
Earlier in the thread you said:
"You can do this in your yourappMain.prg in the OnLoad():"
IF !EMPTY(this.oConfig.nMemUsage)
   SYS(3050,2,THIS.oConfig.nMemUsage)
ENDIF
"Or - I've just added this back into the server here at the bottom of wwServer::Init()"
THIS.OnInitCompleted()

IF !EMPTY(this.oConfig.nMemUsage)
	SYS(3050,2,THIS.oConfig.nMemUsage)
ENDIF

ENDFUNC
* wwServer :: Init
Is one strategy preferable to the other?
TIA
AppPool resets reset the AppPool and that wills shut down the COM servers. So in that respect, yeah it solves the issue of large memory usage in FoxPro as the servers get restarted.
One more question on recycling. Is IIS recycling always 'graceful' like you mentioned?
That depends on what your requests look like. If you have mostly short running requests that take less than a couple of seconds - I would say yes it's graceful. But if you have lots of longer running stuff you may get requests killed on you.
I think one problem with monitoring in VFP is that the memory usage might spike briefly in one server out of your entire server pool. Not sure you want to shut down based on that.
If you really want to do something like this I would perhaps: Create a separate application or service that runs and monitors processes. You can get all that information out of the Windows process list (similar to what the Web Connection status page does). With a separate app you can monitor tresholds of memory and use a timeout to see if it holds for more than a few of minutes or so and then you can shut it down.
But honestly I'm not sure if that's the right approach either. I would just recycle a few times a day and that likely is all you need.
At the end of the day though you need to figure out what's causing the memory creep.
I can say that I don't see it in my 3 apps I'm running here, so I'm fairly confident it's not the framework that's leaking.
+++ Rick ---
+++ Rick ---
Thanks Rick. I believe we're onto something tracking it down with the added logging I did with memory at the start of every request versus after.
Appreciate the clarification. Our servers should never be at 80%+ on ram even if all comm servers have bigger running requests so it's just a fail safe / last ditch effort rather than crashing but we do seem to be making progress in tracking down the leak so hopefully it'll never be needed.