 How to trace code execution on the dotnet side of DotNetBridge
 Alejandro A Sosa
All
May 11, 2020 @ 03:31pm
I am running into an error during a call to DotNetBridge. Evidently it occurs while DotNet code is running. How could one pickup the trace on the other side of DotNetBridge? Would someone kindly point me in the right direction?
Thank you very much,
Alex

 re: How to trace code execution on the dotnet side of DotNetBridge
 Rick Strahl
Alejandro A Sosa
May 11, 2020 @ 04:15pm
Open your .NET Project in Visual Studio, then set up the Debugging to start Visual FoxPro and point it at your application start folder. Then run the project and set a breakpoint.
Pretty easy... and very efficient.
+++ Rick ---
re: How to trace code execution on the dotnet side of DotNetBridge Alejandro A Sosa
Rick Strahl
May 12, 2020 @ 03:47pm
Thank you very much Rick. That information is gold!
For background, I am using your SignalR sample application practically as it is to push messages from a WWC server to a desktop app. It works fine at my office computer but due to a faulty windows update that computer went down so now I am trying at my home computer. Here I've run into the infamous OLE IDispatch exception code 0 from mscorlib message.
That is when I asked you how to debug across DotNetBridge to understand the root problem cause.
As you indicated I asked debugging to start external program VFP in my project directory. However, as soon as I start the VFP program, the red breakpoint mark changes to white indicating that the "breakpoint will not currently be hit because no symbols have been loaded for this document".
How do I load required symbols?
Thanks for all the help.
Alex
re: How to trace code execution on the dotnet side of DotNetBridge Rick Strahl
Alejandro A Sosa
May 12, 2020 @ 04:15pm
Make sure that the compiled output for the DLL in the .NET project goes into your project's folder so that you are compiling to the location where the DLL actually runs. You can change the output location in the Build tab. Alternately you can also set your wwDotnetBridge LoadAssembly() to point at the correct compilation file, but that's tricky between Debug and Release builds, so for wwDotnetBridge invoked projects I usually just write the DLL into my project's folder or a bin folder below it.
You may also need this in your vfp9.exe.config file:
<?xml version="1.0"?>
<configuration>
  <startup>
    <supportedRuntime version="v4.0" sku=".NETFramework,Version=v4.5.2" />
  </startup>
  <runtime>
      <loadFromRemoteSources enabled="true"/>
  </runtime>
</configuration>
I think the version can stay at 4.5.2 and it'll work with later versions, but if not try using your actual project's build target version instead (ie. 4.7.2 most likely).
+++ Rick ---
 re: How to trace code execution on the dotnet side of DotNetBridge
 Alejandro A Sosa
Rick Strahl
May 13, 2020 @ 11:15am
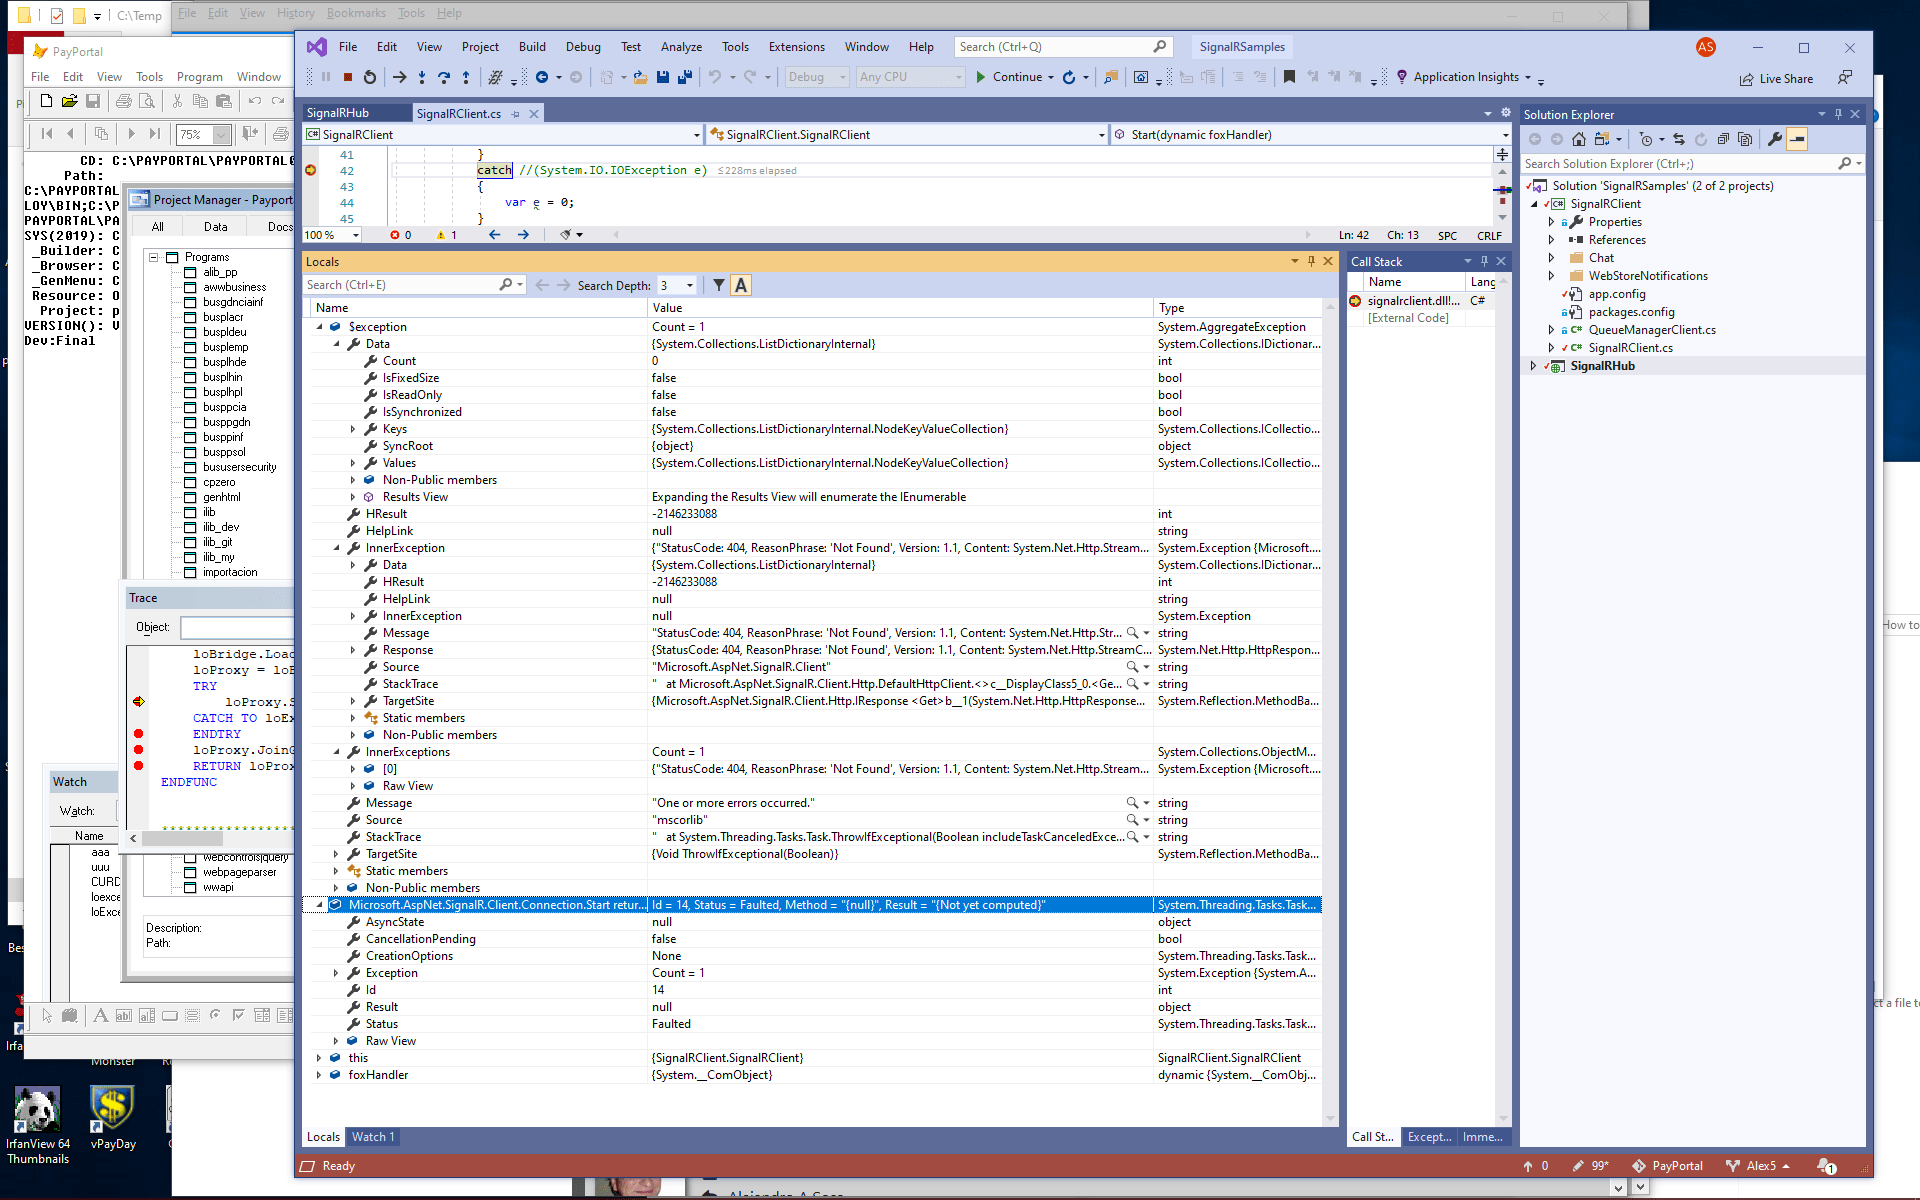
Thank you Rick, I can now trace into SignalRClient.Start()
In my home computer an "OLE IDispatch exception code 0 from mscorlib: One or more errors occurred.." error occurs during the call to Server.Start().Wait(), where Server = new HubConnection(SERVER_NAME). In my office computer it passes that step without problem.
Is there a way to continue tracing into HubConnection to find out precisely what causes the error?
Thank you very much.
Alex
re: How to trace code execution on the dotnet side of DotNetBridge Rick Strahl
Alejandro A Sosa
May 13, 2020 @ 12:39pm
Most likely it's permissions related to port access. Make sure your firewall allows you to get out or allow connections on the ports you have set up. You can put a try catch around the .NET code and see what exceptions you can capture.
+++ Rick ---
re: How to trace code execution on the dotnet side of DotNetBridge Alejandro A Sosa
Rick Strahl
May 13, 2020 @ 04:21pm
Thanks for the suggestion Rick.
I added the try catch but didn't see anything useful in the $exception object, so on to explore if a key port is blocked by firewall.
VS shows that SignalR server uses port http://localhost:53597/.
Considering that both "client" and SignalR Server are in the same machine it would seem there shouldn't be any clashes with an outside firewall at all, and any clashes would be with a PC firewall which in this case is Symantec (ugh)
Does this seem reasonable?
Thanks in advance,
Alex
re: How to trace code execution on the dotnet side of DotNetBridge Rick Strahl
Alejandro A Sosa
May 13, 2020 @ 04:21pm
What is the exception?
re: How to trace code execution on the dotnet side of DotNetBridge Alejandro A Sosa
Rick Strahl
May 13, 2020 @ 04:27pm
re: How to trace code execution on the dotnet side of DotNetBridge Rick Strahl
Alejandro A Sosa
May 14, 2020 @ 03:51pm
Drill into the Exception?
+++ Rick ---
re: How to trace code execution on the dotnet side of DotNetBridge Alejandro A Sosa
Rick Strahl
May 14, 2020 @ 07:33pm
Sorry, I don't know enough VS to give you a good answer.
Can you tell me what specific item values I should drill down for to help diagnose and I'll look for them.
Alex
re: How to trace code execution on the dotnet side of DotNetBridge Rick Strahl
Alejandro A Sosa
May 15, 2020 @ 12:52am
You changed the image 😃
404 is an invalid URL.
+++ Rick ---
re: How to trace code execution on the dotnet side of DotNetBridge Alejandro A Sosa
Rick Strahl
May 15, 2020 @ 01:08pm
😃 I believe I did change the image but you answered so fast that time my change must have gone in after your answer.
So I went back to basics and tried running the SignalRSamples project without calling VFP at start up. Started this way, instead of getting the message that I got in my office computer ("Site Placeholder to ensure Web site is running") I got this instead:
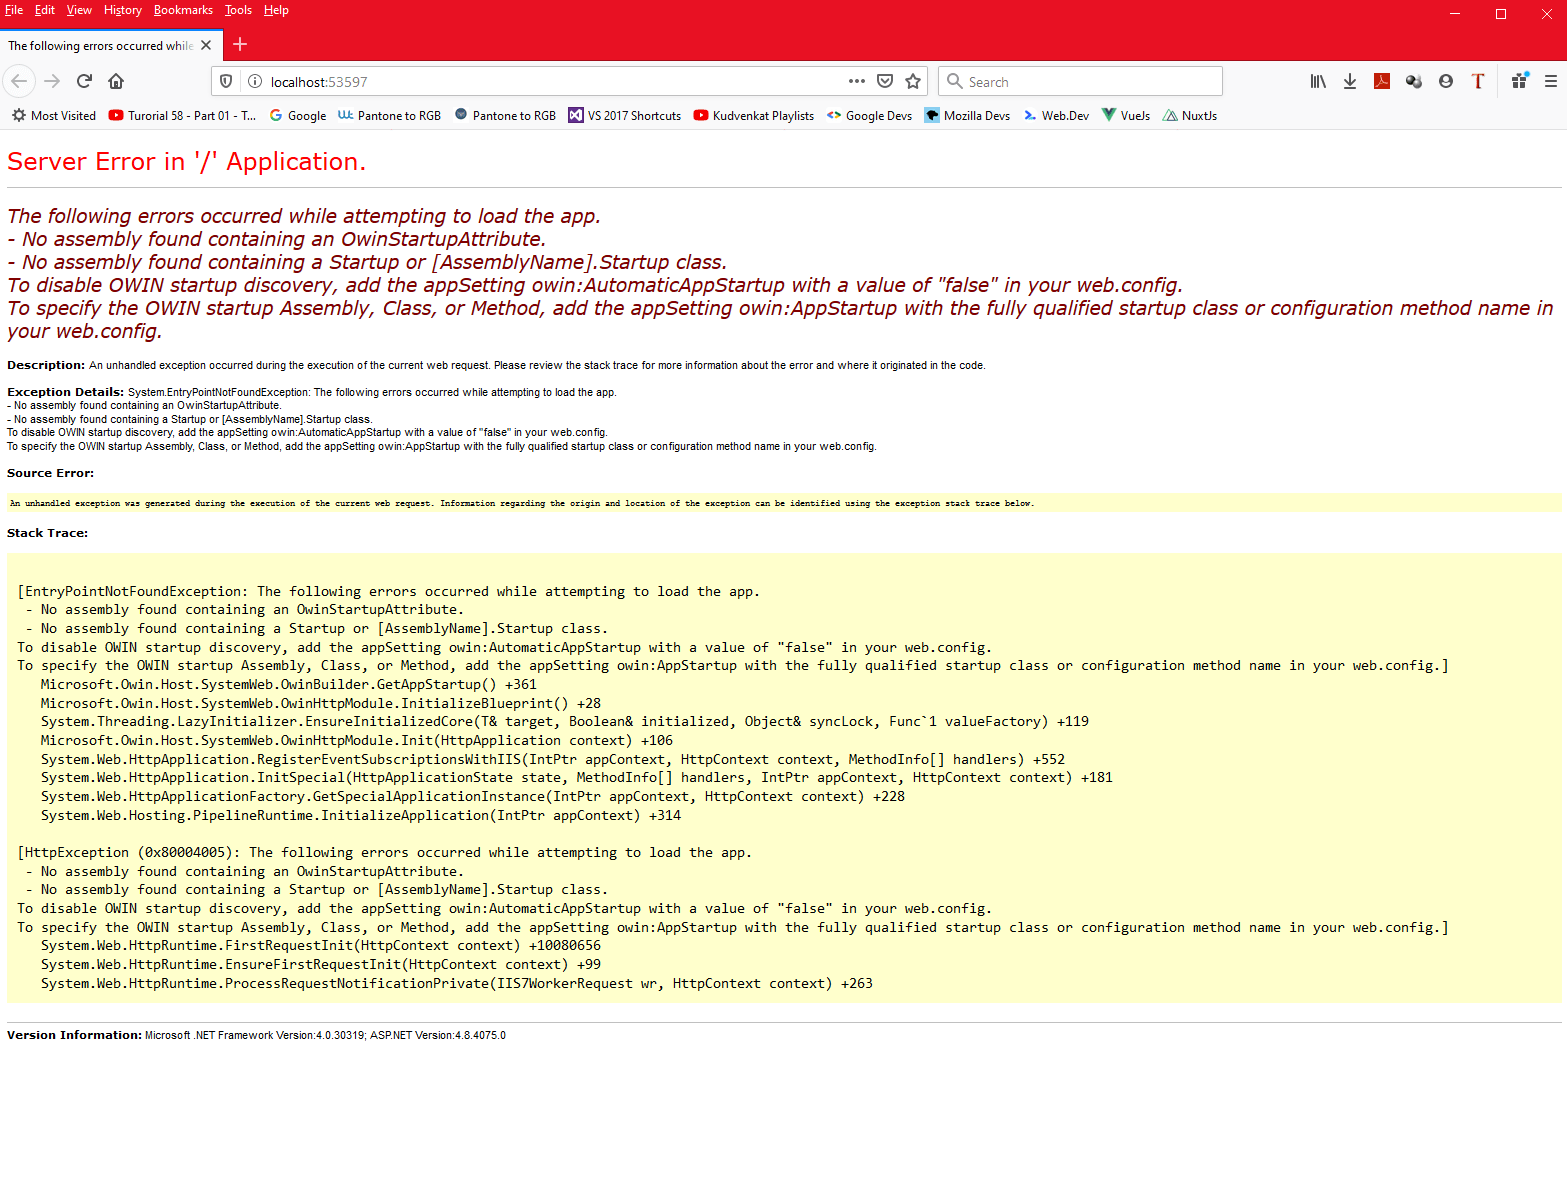
So I reinstalled WWC, IISExpress and IIS (with Install-IIS-Features.ps1) and tried again, but got same problem.
Any suggestions? TIA,
Alex
re: How to trace code execution on the dotnet side of DotNetBridge Rick Strahl
Alejandro A Sosa
May 15, 2020 @ 01:23pm
Sorry no. Looks like you're missing a bunch of assemblies in the project. You need to build the application and make sure it compiles and all dependencies are loaded.
These are samples, and they worked out of box 2 years ago but things change so if you use new projects the assemblies and dependencies might have changed in a new Web api project.
+++ Rick ---
re: How to trace code execution on the dotnet side of DotNetBridge Rick Strahl
Alejandro A Sosa
May 15, 2020 @ 01:48pm
Took a look at the project. Opened the project compiled and ran it and it worked out of the gate. It runs as is without any changes.
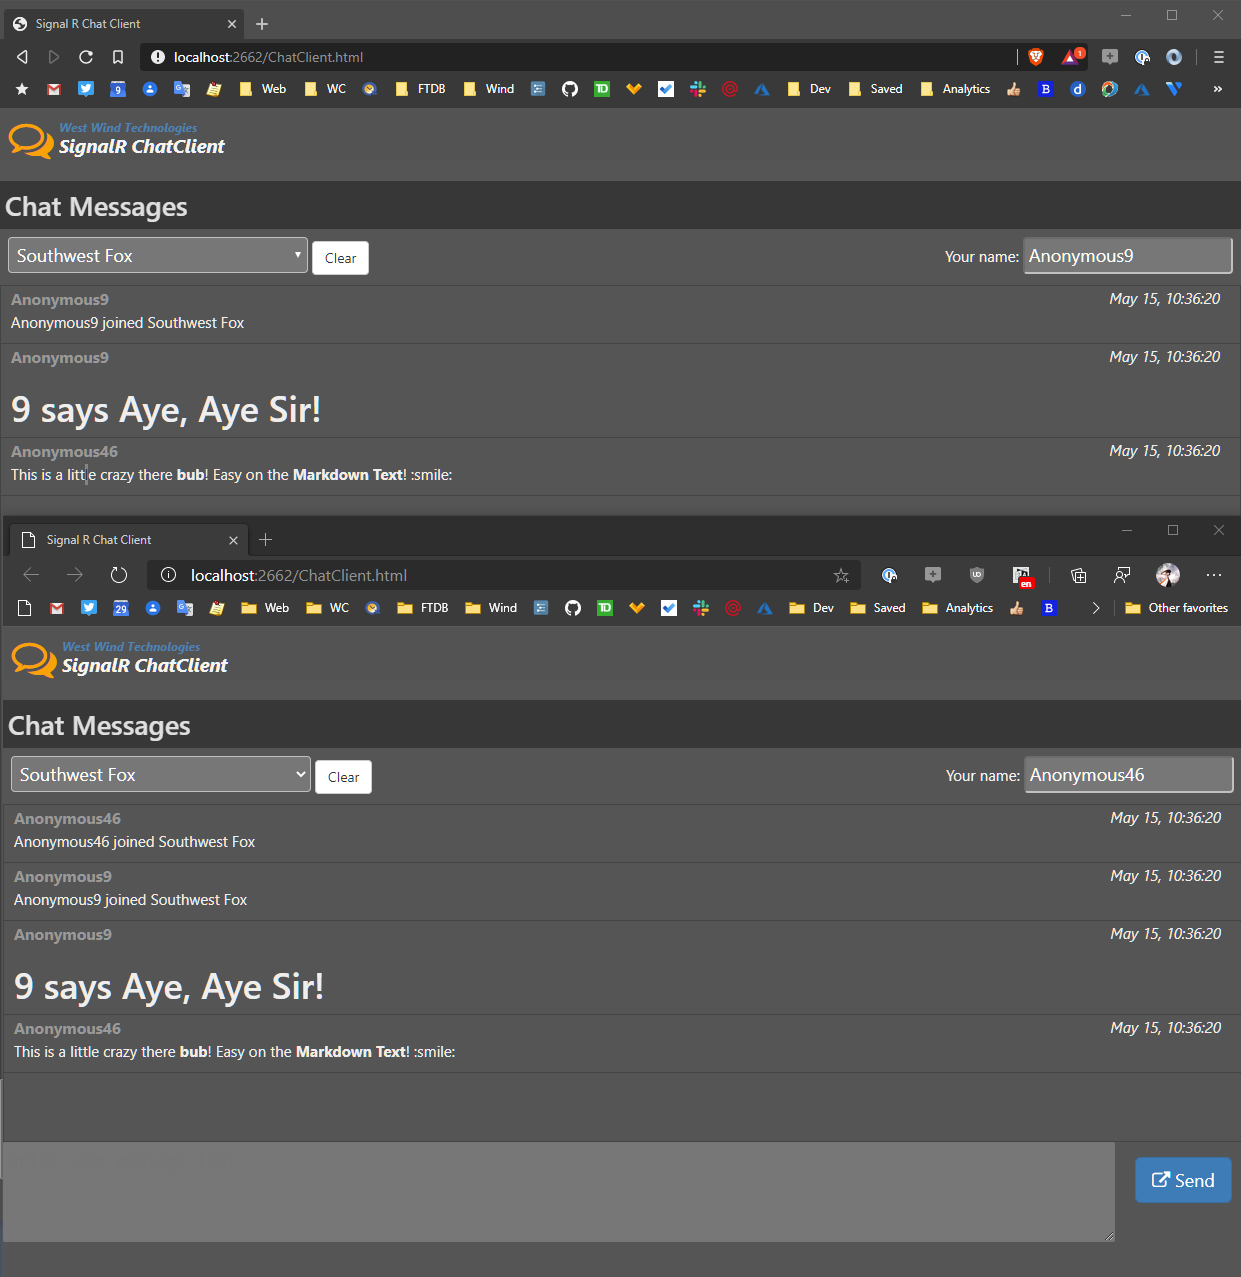
To make the samples work you'll have to change the URLs to point at the local server rather than the live URL of the server that's no longer running that are in the demos, but that are literally two changes:
- Change the script link that points at the SignalR Hubs in the main HTML pages. (chatSample.html)
- Change the signal server to the local server in the various scripts (chatSample.js)
+++ Rick ---
re: How to trace code execution on the dotnet side of DotNetBridge Alejandro A Sosa
Rick Strahl
May 19, 2020 @ 08:28am
Hi Rick,
I got confused while trying to "point at the local server rather than the live URL of the server that's no longer running" and kept getting 404 errors.
Since I am so unpracticed at developing for the web, I took some cues from your commented out code.
For example, in some places your code includes stuff such as this:
    <!--<script src="http://localhost/SignalRHub/signalr/hubs" ></script>-->
    <script src="http://signalrswf.west-wind.com/signalr/hubs"></script>
I decided to replace all "signalrswf.west-wind.com" with "localhost/SignalRHub", but kept getting 404s.
To boot, visual studio assigned a port to the project URL: http://localhost:51842/, so I wondered if I should make reference to "localhost:51842" everywhere instead of "localhost".
Lately I've started to think that some of your comments may have been obsolete and that I should simply replace "signalrswf.west-wind.com" with "localhost:51842", leaving our the "SignalRHub" part.
As you can imagine, this all led to guesses and swings in the dark.
Would you please help me with this?
TIA,
Alex
re: How to trace code execution on the dotnet side of DotNetBridge Rick Strahl
Alejandro A Sosa
May 19, 2020 @ 12:29pm
The URLS are set up for the live site that is no longer running. The other URLs are local full IIS urls for which you have to configure a Web site/virtual in IIS.
If you use IIS Express as you are you have to replace those localhost URLs with localhost:port (replace the live URL not the localhost url as that has a virtual subfolder that you don't want with the IIS Express localhost:port).
+++ Rick ---